Prometheus : Scrape Target Basics
Channel:

Subscribers:
26,100
Published on ● Video Link: https://www.youtube.com/watch?v=1Jx9AzNhGjU
Documentation : https://sbcode.net/prometheus/scrape-targets/
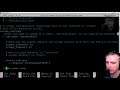
When you install Prometheus using
# apt install prometheus
It sets up two metrics endpoints. One for Prometheus and the other for a default node exporter that is also installed.
They are both listening at
http:127.0.0.1:9090/metrics and
http:127.0.0.1:9100/metrics
In this video, I show where the settings are configured for these metrics endpoints, how to enable or change them and show some of the properties that can be retrieved in the graph expressions field.
Other Videos By SBCODE
| 2020-09-29 | Connect SIM800C SMS Module to a Raspberry PI |
| 2020-09-27 | Prometheus : Adding the Alert Manger UI |
| 2020-09-26 | Prometheus : Configure Alert Manager SMTP Settings |
| 2020-09-25 | Prometheus : Install Send Only SMTP Server |
| 2020-09-25 | Prometheus : Install Alertmanager |
| 2020-09-24 | Prometheus : Alerting Rules |
| 2020-09-24 | Prometheus : Recording Rules |
| 2020-09-23 | Prometheus : PromQL Example Queries |
| 2020-09-22 | Prometheus : Deleting a Time Series |
| 2020-09-22 | Prometheus : Install an External Node Exporter |
| 2020-09-21 | Prometheus : Scrape Target Basics |
| 2020-09-20 | Prometheus : Add Basic Authentication to the User Interface |
| 2020-09-20 | Prometheus : Add SSL to Nginx Reverse Proxy |
| 2020-09-20 | Prometheus : Setup Reverse Proxy with Nginx |
| 2020-09-20 | Prometheus : Install |
| 2020-09-19 | Dynamic Graphs in Grafana 6 |
| 2020-09-19 | Grafana : Dynamic Singlestats |
| 2020-09-19 | Dynamic Tables from Dashboard Variables in Grafana 6 |
| 2020-09-19 | Dashboard Variables in Grafana 6 |
| 2020-09-19 | Grafana : Bar Gauge Panel |
| 2020-09-19 | Grafana : Gauge Panel |
Tags:
prometheus
prometheus engineer
prometheus scrape targets