NAT 4 Statistics Lesson 5: Scatter Graphs - Part 1 Identifying Correlation

National 4 Applications of Mathematics: Statistics Skills - Scatter Graphs Part 1 - Identifying Correlation
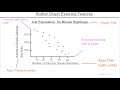
Note - Something I forgot to mention in the video. Although this is contested, when naming a graph, many scientists and engineers tend to name them Y (vertical axis label) vs X (horizontal axis label) as that fits in with experiments where one variable is varied in set increments(amounts) on the horizontal X axis and change in the other is recorded on the vertical Y axis. This isn't a legal requirement, the graph standards society (GSS) will not come to your door in the middle of the night looking for vengeance if you disobey. The main thing is that someone looking at the graph should know what is about from the title.
Note - Some slides may appear bright when using google chrome on a desktop.